ionic serve현재 개발중인 Application 에서 통계를 위해 그래프를 그리기 위해 Chart.js 사용하기로 정했다.
Chart.js는 Open Source 로 무료로 사용이 가능한 HTML5 용 JavaScript 라이브러리이다.
Chart.js | Open source HTML5 Charts for your website
New in 2.0 New chart axis types Plot complex, sparse datasets on date time, logarithmic or even entirely custom scales with ease.
www.chartjs.org
적용 순서
- 테스트 앱 생성
1. Chart.js 다운로드
2. Chart.js Import
3. Chart 생성
Ionic 앱을 생성하는 것은 이전 게시글에서 다뤘으므로 넘어간다.
궁금하신 분은 참고하세요 2019/12/02 - [Mobile] - [ Ionic ] 웹개발자가 만드는 Ionic 어플 - 1탄 (설치, 오픈 소스 활용)
- 메뉴별로 그래프를 추가하여 확인할 목적으로 slidemenu를 가진 Ionic 프로젝트를 생성한다.
ionic start ioninChartJs sidemenu
- 생성된 프로젝트 루트로 들어가 ionic serve를 실행하여 브라우저에서 생성한 앱을 확인한다.
cd ionicChartJs
ionic serve
- npm을 통해 chart.js 를 설치한다.
- 설치가 완료되면 package.json에 버전이 추가됨과 node_modules안에서 라이브러리 확인이 가능하다
npm install chart.js

- /src/app/home/home.module.ts에서 chart.js 를 import 한다.
import { Chart } from 'chart.js';
- /src/app/home/home.page.html 에는 그래프 태그를 추가한다.
- #barChart 를 통해 해당 태그에 그래프를 그릴 수 있게된다.
<ion-header>
  <ion-toolbar>
    <ion-buttons slot="start">
      <ion-menu-button></ion-menu-button>
    </ion-buttons>
    <ion-title>
      Home
    </ion-title>
  </ion-toolbar>
</ion-header>

<ion-content>
  <ion-list-header>Bar Chart</ion-list-header>
  <ion-card class="welcome-card">
    <ion-card-content>
      <canvas #chart></canvas>
    </ion-card-content>
  </ion-card>
</ion-content>
- /src/app/home/home.page.ts 에 그래프 옵션을 추가한다.
import { Component, ViewChild } from '@angular/core';
import { Chart } from 'chart.js';

@Component({
  selector: 'app-home',
  templateUrl: 'home.page.html',
  styleUrls: ['home.page.scss'],
})
export class HomePage {
  @ViewChild('chart', {static: true}) chart;

  bars: any;
  colorArray: any;
  constructor() { }

  ionViewDidEnter() {
    this.createBarChart();
  }

  createBarChart() {
    this.bars = new Chart(this.chart.nativeElement, {
      type: 'bar',
      data: {
        labels: ['1월','2월','3월','4월','5월','6월','7월','8월'],
        datasets: [{
          label: '평균 기온',
          data: [2.5, 3.8, 5, 6.9, 6.9, 7.5, 10, 40],
          backgroundColor: 'rgb(255, 40, 0)', // 그래프 색
          borderColor: 'rgb(255, 40, 0)',// 테두리 색
          borderWidth: 1
        }]
      },
      options: {
        scales: {
          yAxes: [{
            ticks: {
              beginAtZero: true
            }
          }]
        }
      }
    });
  }
}
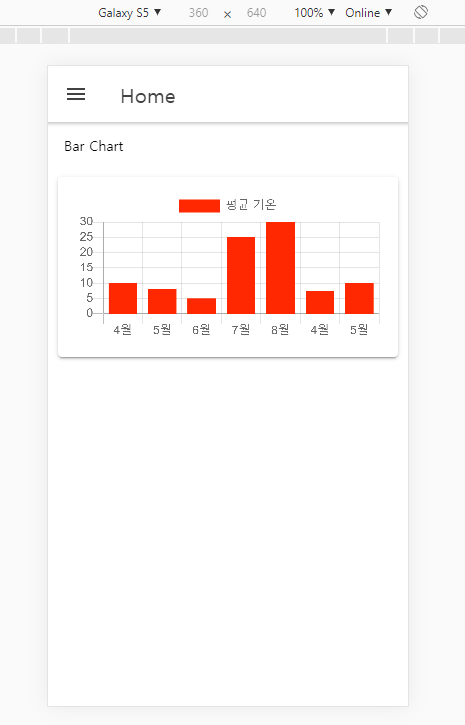
- 아래와 같은 화면을 확인할 수 있다.

소스는 해당 저장소에서 확인 가능하다.
'Mobile' 카테고리의 다른 글
| [ Ionic ] 웹개발자가 만드는 Ionic 어플 - 3탄 (배포) (0) | 2020.04.04 |
|---|---|
| [ Ionic ] 웹개발자가 만드는 Ionic 어플 - 2탄 (기초 구성 및 구현) (0) | 2020.01.31 |
| [ Ionic ] 태그 노출, 비노출 처리 (0) | 2019.12.08 |
| [ Ionic ] 웹개발자가 만드는 Ionic 어플 - 1탄 (설치, 오픈 소스 활용) (2) | 2019.12.02 |
| [Android] Uri.parse 예제 소스 (0) | 2019.04.12 |


댓글